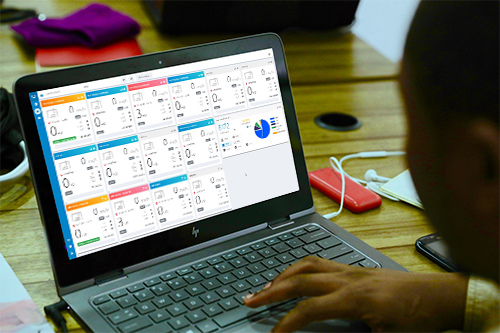
The « Dashboard » module allows you to create one or more dashboards. It is thus possible to follow the productivity of a terminal in real time, thanks to the graphical “widgets” available. Available widgets are listed below and the number of widgets available will increase depending on your requests.
Terminal performance and security at a glance
Currently available widgets include :
- Monitor in real time the activity and performance of selected RTGs,
- Search for containers in the yard and access the full history of container movements,
- Highlight containers in error zone,
- Highlight missions that cannot be processed for various reasons.
- List next calls and operations to be performed
Thanks to a modern and intuitive interface, the widgets make it possible to :
- Make a summary of your terminal KPIs and relevant information available on OSCAR,
- Monitor activities on your terminal in real time
- Drive your terminal more efficiently
A dashboard configurable to fit your terminal needs
Users can set up as many dashboards as they want and arrange them to their convenience. Widgets refreshing can be periodic or event (as soon as an action occurs).
A dashboard can be private or shared. If shared, the dashboard can be used by multiple users.
Each widget is :
- Independent,
- Configurable
- Reusable.